Do tall players miss more penalties? I checked 30,000 kicks to find out

Watching the Socceroos go out to Egypt on penalties at the 2026 World Cup made me wonder about player height vs penalty success rate. Both Australian defenders who missed – Harry Souttar and Lucas Herrington – are tall. Souttar is 198 cm. Herrington is 193 cm.

On the back of the Champions League shootout where Gabriel (190cm) also missed, I wondered if there is anything statistically meaningful relating to player height and penalty success rate.

The question

Is there a relationship between a player’s height and whether they score from the spot? And does it differ for in-game penalties versus shootouts, where the pressure is obviously different?

The data

For penalties, I used the dataset from Vollmer, Schoch and Brandes (2024) – roughly 51,000 cleaned penalty attempts from European men’s football between 2012–13 and 2022–23, plus World Cups in 2014, 2018 and 2022. Each row is a single kick: scored or not.

For height, I used Transfermarkt data, matching players by name.

Of the 51,007 penalties, the height data matched for 29,803 (about 58%). The unmatched penalties are mostly from smaller leagues where Transfermarkt coverage is thinner.

The matched sample covers 9,744 unique takers, heights ranging from 160 cm to 203 cm, with a mean of about 182 cm.

What the numbers say

Shootouts are harder

ContextPenaltiesSuccess rate
In-game20,82781.4%
Shootout8,97675.5%

That ~6 percentage point gap matches what Vollmer et al. found. Shootouts are different.

Height? Not signficant

Here’s success rate by 10 cm height band, all players, all positions:

HeightAttemptsSuccess rate
160–169 cm62478.4%
170–179 cm9,90279.5%
180–189 cm16,10579.7%
190–199 cm3,11879.8%
200–209 cm5483.3%

From 170 cm upward, it’s essentially a flat line around 79–80%. The 200+ cm group looks better, but with only 54 attempts it’s not a large enough data set.

Using the 180 cm threshold:

  • In-game: under 180 cm scored 81.4% of the time; 180 cm and over scored 81.4%
  • Shootout: under 180 cm scored 74.9%; 180 cm and over scored 75.9%

Splitting into height quartiles tells the same story. The tallest quarter doesn’t consistently underperform the shortest.

Statistically, the correlation between height and scoring is effectively zero (Pearson r = 0.003, p = 0.57). A logistic regression gives an odds ratio of 1.001 per centimetre of height – meaning each extra centimetre changes your odds of scoring by about 0.1%. That’s not significant. The shootout interaction term is also insignificant (p = 0.95), so height doesn’t affect in-game and shootout penalties differently either.

Short (?) version: being tall doesn’t make you more likely to miss, or more likely to score.

Look at defenders only, the results are similar – no significant impact on success based on player height.

Splunk & my Twitter archive

Recently I’ve been having a great time playing with Splunk. Splunk is a big data platform that allows you to search practically any machine data and present it in ways that will give you insight into what you have. It has practical applications for application management, IT operations, security, compliance, big data as well as web and business analytics.

I downloaded the free trial version, installed it locally and played with some personal data sources including phone bills, bank statements, my personal twitter archive as well as some weather data I downloaded from the Bureau of Meteorology.

Below are a few of the interesting charts that came out of my Twitter archive (@dan_cake), along with the basic search query used to extract and present the data in this way. Click to view a full-sized version.


Tweets by month

sourcetype=twitter_csv

Tweets peaked in July 2010 when I sent on average almost 4 tweets per day. The first drop in usage is probably due to the birth of my first child and then the subsequent months where there was hardly any usage is due to just being too busy at work and at home.

Tweets per hour of day
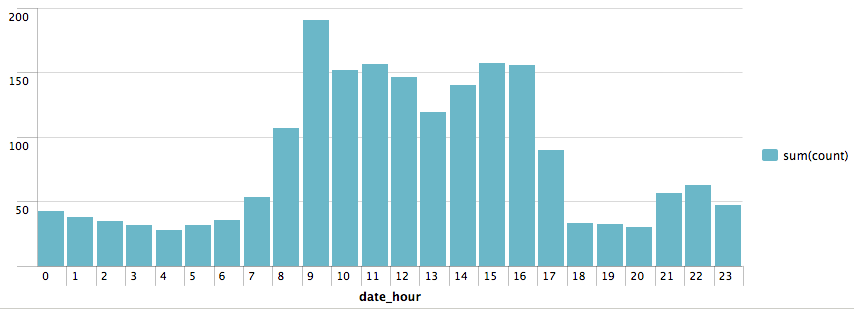
sourcetype=twitter_csv | stats count BY date_hour | chart sum(count) By date_hour

Most tweets were sent between 9am-5pm but there is an dip around lunchtime and an interesting smaller increase in usage between 9pm-11pm. What really surprised me about this was the volume of tweets sent between 1am and 5am. Drilling down into the data is seems that some of these are due to issues with the timezone of the device I was on.

Tweets sent by Twitter client

sourcetype=twitter_csv | rex field=client "<*>(?<client>.*)</a>" | eval client=lower(client) | top client

Also I was surprised by this. I know I have been searching for the perfect client but had forgotten just how many I have been through!

The search query involved stripping some HTML tags from some of the client values with regex as well as matching on lowercase to get around inconsistencies with the same client having different capitalisation.